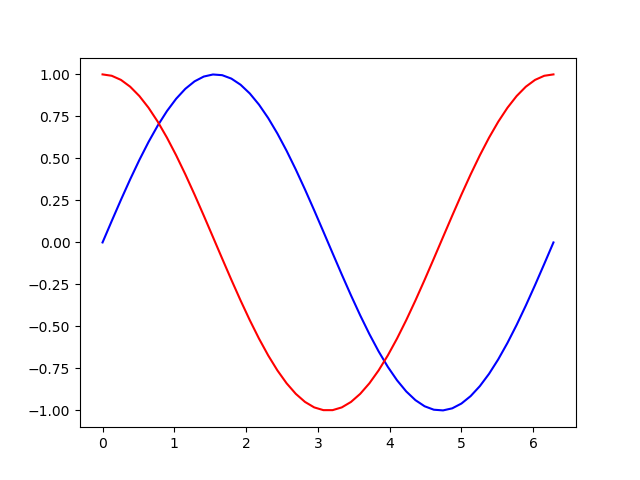
Introduction to matplotlib – Part 3

  After laying the foundation in Introduction to matplotlib and Introduction to matplotlib – Part 2 I want to show you another important chart Bar Charts A bar chart is useful to show total values over time e.g. the revenue of a company. years = (2017, 2018, 2019) revenue = (5000, 7000, 9000) plt.bar(years, revenue, width=0.35)…

Linear Regression with sklearn – cheat sheet

# import and instantiate model from sklearn.linear_model import LinearRegression model = LinearRegression() #prepare test data features_train = df_train.loc[:, ‘feature_name’] target_train = df_train.loc[:, ‘target_name’] #fit (train) model and print coefficient and intercept model.fit(features_train , target_train ) print(model.coef_) print(model.intercept_) # calculate model quality from sklearn.metrics import mean_squared_error from sklearn.metrics import r2_score target_prediction = model.predict(features_train) print(mean_squared_error(target_train , target_prediction))…

SQL-LIKE and wildcards

This article is part of my SQL-Tutorial Motivation Sometimes you need to retrieve data from a database without knowing the exact string to look up so wildcards for the rescue Underscore Se_en represents a pattern with a wildcard character. The _ means you can substitute any individual character here without breaking the pattern. It matches…

SQL-Basics: Relations

As the Junior Data Scientist of Knight Industries we created a table to keep track of all our operatives: SQL-Basics: Create, Read, Update, Delete Devon asks us to keep track of our operations aka missions as well. For the first implementation let us assume that a mission has one operative and an operative can participate…

SQL-Functions – SQL-Basics 3

In SQL-Basics we learned the standard SQL statements to create a table, insert data into it, retrieving data from tables and altering data. Now we want to do even Devon is a data driven man and to evaluate our mission, he likes to know from us: how many missions we finished the total cost of…

Introduction to matplotlib

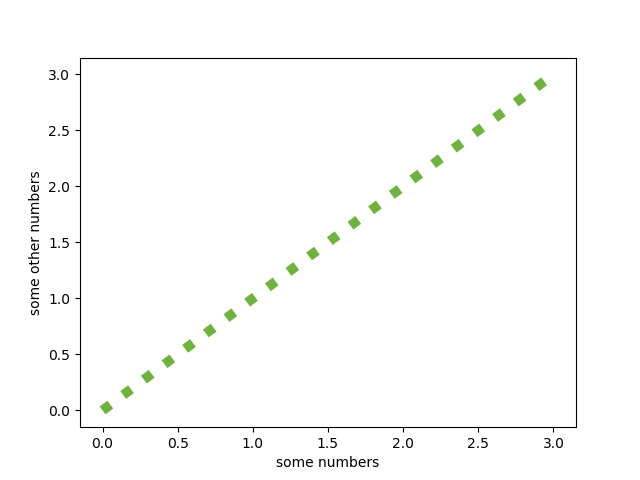
Overview matplotlib is the workhorse of data science visualization. The module pyplot gives us MATLAB like plots. You can install it via pip install matplotlib The most basic plot is done with the “plot”-function. It looks like this: import matplotlib.pyplot as plt plt.plot([0, 1, 2, 3], [0, 1, 2, 3]) plt.show() The plot function takes…

Scatterplot with matplotlib

When you area already familiar with the basic plot from the introduction to matplotlib here is another type of plot used in data science. A very basic visualization is the scatter plot: import numpy as np import matplotlib.pyplot as plt N = 100 x = np.random.rand(N) y = np.random.rand(N) plt.scatter(x, y) plt.show() Color of the…