Table of Contents
Motivation
When you are going to learn some data science the aquisition of data is often the first step.
To get you started scikit-learn comes with a bunch of so called “toy datasets”. One of them is the Iris dataset.
Prerequisites & Imports
Besides scikit-learn we will use pandas for data handling and matplotlib with seaborn for visualization. So let’s install them:
pip install scikit-learn pandas seaborn matplotlibfrom sklearn import datasets
import seaborn as sns
import pandas as pd
sns.set_palette('husl')
import matplotlib.pyplot as plt
%matplotlib inlineIris data set
The Iris flower data set or Fisher’s Iris data set became a typical test case for many statistical classification techniques in machine learning such as support vector machines.
It is sometimes called Anderson’s Iris data set because Edgar Anderson collected the data to quantify the morphological variation of Iris flowers of three related species.
This data set can be imported from scikit-learn like the following:
iris = datasets.load_iris()
Convert to Pandas Dataframe
To work with the dataset we convert it into a pandas dataframe.
df = pd.DataFrame(
    iris['data'],
    columns=iris['feature_names']
)
df['species'] = iris['target']
df['species'] = df['species'].map({
    0 : 'Iris-setosa',
    1 : 'Iris-versicolor',
    2 : 'Iris-virginica'
})
Data visualization
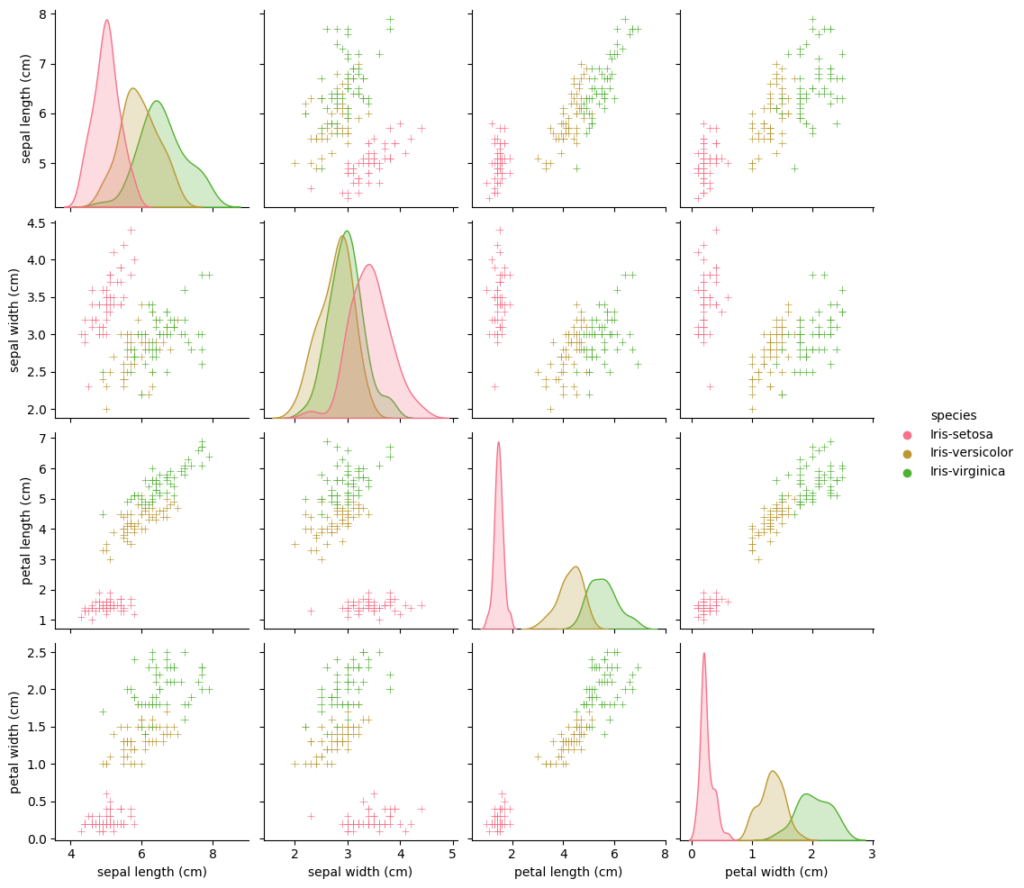
Seaborn has a nice way to visualize data for exploration with the pariplot function.
It takes every feature and compares it pairwise with every other feature
g = sns.pairplot(df, hue='species', markers='+')
plt.show()
Further Reading
https://scikit-learn.org/stable/datasets/toy_dataset.html#iris-plants-dataset
https://www.kaggle.com/code/jchen2186/machine-learning-with-iris-dataset


