What is Big Data
Big Data is a buzz word nowadays. But when is data “big data”?
In Regular Expressions Demystified I developed a little python package and distributed it via PyPi. I wanted to publish my second self-written package as well, but coming back after almost a year, some things have changed in the world of PyPi, i.e. the old tutorials aren’t working anymore. So I wrote this article to bring…
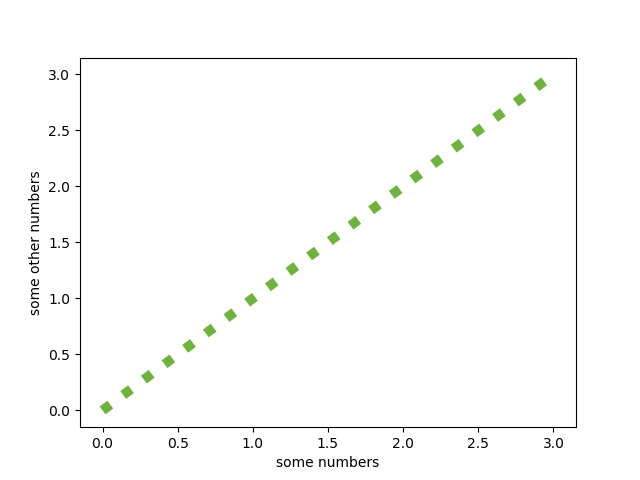
Overview matplotlib is the workhorse of data science visualization. The module pyplot gives us MATLAB like plots. You can install it via pip install matplotlib The most basic plot is done with the “plot”-function. It looks like this: import matplotlib.pyplot as plt plt.plot([0, 1, 2, 3], [0, 1, 2, 3]) plt.show() The plot function takes…
When you area already familiar with the basic plot from the introduction to matplotlib here is another type of plot used in data science. A very basic visualization is the scatter plot: import numpy as np import matplotlib.pyplot as plt N = 100 x = np.random.rand(N) y = np.random.rand(N) plt.scatter(x, y) plt.show() Color of the…
What is Feature Scaling? Feature Scaling is an important pre-processing step for some machine learning algorithms. Imagine you have three friends of whom you know the individual weight and height. You would like to deduce Christian’s t-shirt size from David’s and Julia’s by looking at the height and weight. Name Height in m Weight in…
When You are working with different operating systems you encounter different line endings. Editing a file on a Linux system and opening it on a windows machine can give a weird result. Here is a short overview which system uses which command characters: OS Command character Windows CR + LF Linux LF Mac OS <=…
ROC Curve As we already introduced Precision and Recall the ROC curve is another way of looking at the quality of classification algorithms. ROC stands for Receiver Operating Characteristic The ROC curve is created by plotting the true positive rate (TPR) on the y-axis against the false positive rate (FPR) on the x-axis at various…
Pandas is a data analyzing tool. Together with numpy and matplotlib it is part of the data science stack You can install it via pip install pandas Working with real data The data set we are using is the astronauts data set from kaggle: Download Data Set NASA Astronauts from Kaggle During this introduction we…
If You already read Python pip and virtualenv you are familiar with the way python handles requirements. but lo and behoild there is a new kid in town or actually two new kids on the block: Pipfile and Pipenv – both with with a capital “P”. If you are tired of creating and maintaining…
Applying for a data scientist job offer? Tired of writing the same old curriculum vitae? Why not showing your data visualization skills directly in your application? Generate Data Instead of pressing your data about education, employment and skills in a word-like document, put it in tables instead. E.g. use open office to create and edit…